[Python] IoU, NMS, AP, mAP 간단 설명, 코드
[Python] IoU, NMS, AP, mAP 설명, 코드
Object Detection을 하다보면 만나게 되는 용어로 IoU, NMS, AP, mAP가 있다.
이에 대한 설명과 코드를 간단히 작성해보고자 한다.
IoU
IoU 설명
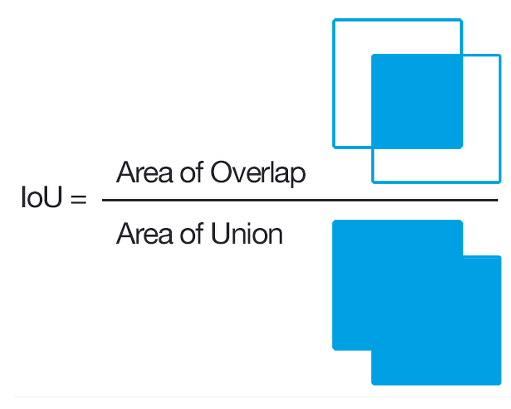
IoU는 Intersection over Union의 약자로 집합에서는 교집합 부분에 대한 확률이라고 생각하면 편하다. Object Detection에서는 Ground Truth에 해당하는 Bounding box와 Prediction에 해당하는 Bounding box에 대한 교차 영역의 겹침 정도를 구하기 위해 사용한다. 보통 0.5 이상을 관대하게 이야기하지만 0.75 혹은 0.9까지의 겹침 정도가 있을 때 사용해봄직한 bounding box라고 판단한다고 한다.
Ground Truth - Bounding box를 A, Prediction - Bounding box를 B라고 할 때, 식은 다음과 같다.
$$IoU = {Intersection \over A + B -Intersection}$$
IoU 코드
Object Detection에서는 bounding box에 대한 정보를 2가지 방법으로 준다.
1) x1, y1, x2, y2
(x1, y1)는 좌측 상단을 의미하는 좌표
(x2, y2)는 우측 하단을 의미하는 좌표
2) x1, y1, w, h
(x1, y1)는 좌측 상단을 의미하는 좌표
w, h는 bounding box에 대한 너비와 높이
우리는 2개의 bounding box가 주어진다고 가정할 것이고 1)에 대한 식일 때 코드를 짜보겠다.
교집합 사각형의 x1,y1,x2,y2를 구할 때
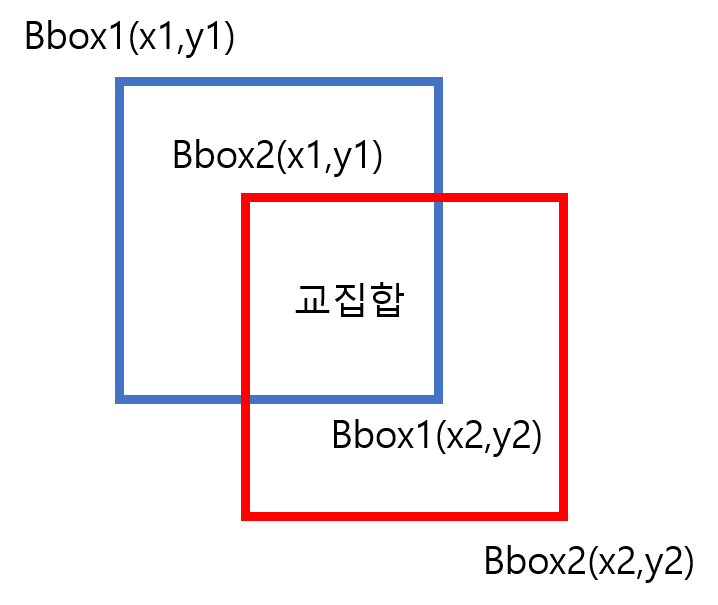
intersection_x1 = max(bbox1[0], bbox2[0])
intersection_y1 = max(bbox1[1], bbox2[1])
intersection_x2 = min(bbox1[2], bbox2[2])
intersection_y2 = min(bbox1[3], bbox2[3])
교집합 구하기 (교집합이 없을 때는 0으로 만들기 위해 max(0, ~)를 넣음
intersection = max(0, intersection_x2-intersection_x1) * max(0, intersection_y2-intersection_y1)
전체 코드는 다음과 같다.
def IoU(bbox1, bbox2):
    # bbox shape = [x1, y1, x2, y2]
    intersection_x1 = max(bbox1[0], bbox2[0])
    intersection_y1 = max(bbox1[1], bbox2[1])
    intersection_x2 = min(bbox1[2], bbox2[2])
    intersection_y2 = min(bbox1[3], bbox2[3])

    intersection = max(0, intersection_x2-intersection_x1) * max(0, intersection_y2-intersection_y1)

    box1_area = abs((bbox1[2] - bbox1[0]) * (bbox1[3] - bbox1[1]))
    box2_area = abs((bbox2[2] - bbox2[0]) * (bbox2[3] - bbox2[1]))

    return intersection / (box1_area + box2_area - intersection + 1e-7)
참조
NMS
NMS 설명
NMS는 Non-Maximum Suppression의 약자로 Object Detection에서 class별로 생성된 다양한 Bounding box에 대해 가장 높은 확률의 Bounding box를 선정하는 작업이라고 생각하면 편하다.
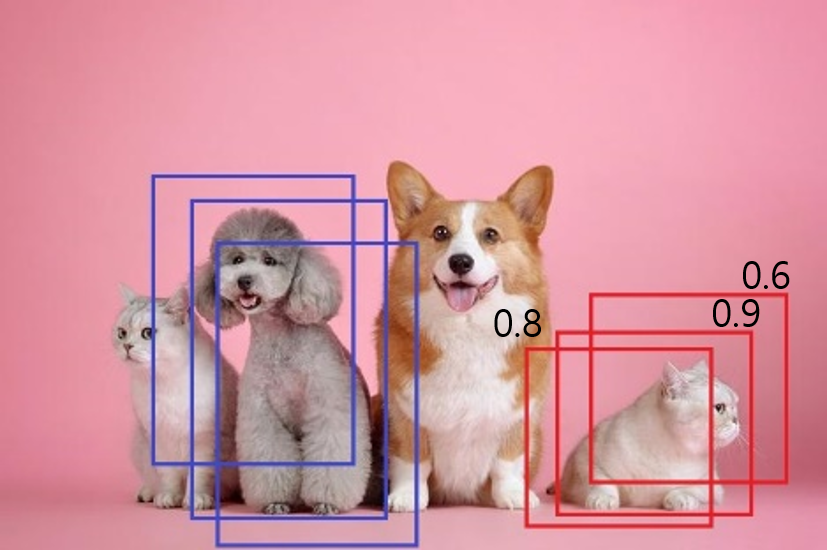
가령 위 그림처럼 우측 고양이에 3개의 bounding box가 존재한다. 이때 각 bounding box에는 해당 클래스에 대한 확률이 나와있다.
NMS는 각각의 bounding box에 대하여 IoU가 일정 threshold 이상일 때 확률을 비교하는 것으로써 위 이미지에서는 고양이 클래스에 대해 0.9의 확률을 가진 bounding box와 좌측 강아지 클래스 역시 높은 확률의 bounding box만이 살아남을 것이다.
NMS 코드
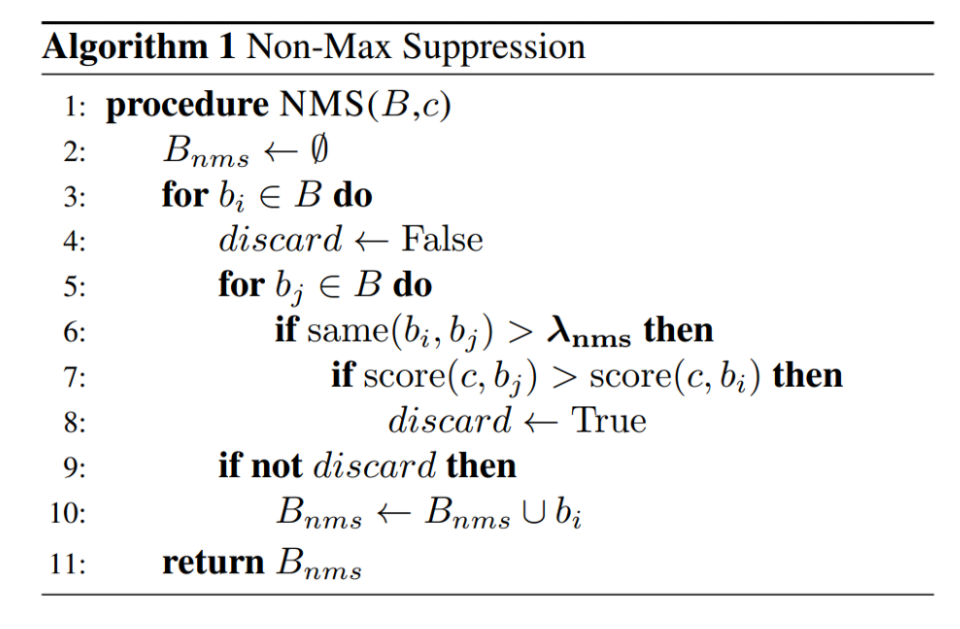
해당 함수를 수행함에 있어 bounding box은 다음과 같은 리스트 형태라고 가정한다.
bounding box 1의 list = bbox-1 = [class_label, prediction probability, x1, y1, x2, y2]
bounding boxes = [bbox-1, bbox-2, ..., bbox-n]
우선 앞서 설명한 것과 마찬가지로 각 bounding box들에 있어 prediction probability threshold를 넘는지 확인한다. 이 부분은 일종의 confidence score에서 특정 임계점을 넘는지 확인하는 것이다.
bboxes = [box for box in bboxes if box[1] > threshold]
그 후 bounding box들의 확률이 높은 것 순으로 정렬한다. (내림차순, 높은 confidence score순서)
bboxes = sorted(bboxes, key=lambda x: x[1], reverse=True)
이제 각 클래스별로 IoU가 일정 threshold를 넘는 부분에 대해 비교할 것이고 클래스별로 가장 높은 confidence score의 bounding box만이 살아남도록 코드를 정리한다.
이를 통해 bboxes_after_nms라는 list를 반환한다.
bboxes_after_nms = []

while bboxes:
    chosen_box = bboxes.pop(0)

    bboxes = [
        box
        for box in bboxes
        if box[0] != chosen_box[0]
        or IoU(chosen_box[2:], box[2:]) < iou_threshold
    ]

    bboxes_after_nms.append(chosen_box)

return bboxes_after_nms
본 코드는 개념적으로만 활용하시고 실제로 활용하시기 위해서는 IoU 별도 함수를 만들어서 특정 수치값이 반환되도록 구성하면 됩니다.
참조
AP, mAP
AP, mAP 개념
AP는 Average precision의 약자로 R-CNN, SSD 계열의 object detection의 정확도를 측정하는 유명한 지표이다.
이를 알기 위해 우선 Precision과 Recall에 대한 설명이 필요하다.
설명에 앞서 Confussion Metric에 대해 살펴보자
| Predicted Result | |||
| 0: Negative | 1: Positive | ||
| Ground Truth | 0: Negative | TN | FP |
| 1: Positive | FN | TP/TP | |
ML을 공부해본 사람이라면 많이 봤을 표이다. 이에 대한 Precision & Recall 역시 마찬가지로 많이 봤을 내용인데 이를 간략히 설명하면 다음과 같다.
$$Precision = \frac{TP}{TP+NP},\ Recall=\frac{TP}{TP+FN}$$
식에서도 확인할 수 있지만 간단히 풀어쓸 수 있다.
Precision은 Positive로 예측한 것들 중에서 실제 값과 일치하는 비율
=> 예측한 Bounding box들 중 올바르게 예측한 Bounding box의 비율
Recall은 실제 Positive인 것들 중에서 예측값과 일치하는 비율
=> 실제 Ground Truth Bounding box들 중 올바르게 예측한 Bounding box의 비율
Precision and Recall관련 자료 추천
https://driip.me/cc48042b-a3fa-4aa8-b559-383d9806baba
Object Detection에서의 Precision, Recall
Precision, Recall 개념을 Object Detection에 적용하여 알아보자. 궁극적으로는 mAP를 이해하기 위해 필요하다.
driip.me
기본적으로 Precision과 Recall은 Tradeoff이기때문에 어느 한쪽이 오르면 어느 한쪽은 떨어지기 마련이다.
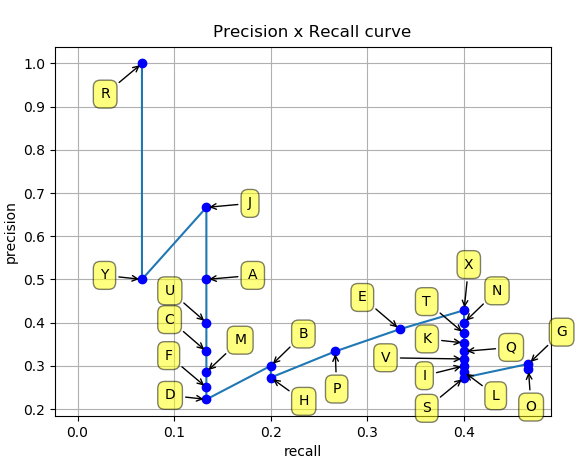
AP는 바로 이 Precision-Recall Curve의 면적을 의미한다. 여기까지 배운 것을 아래 github에서 정리한 내용으로 다시 살펴보자.
https://github.com/rafaelpadilla/Object-Detection-Metrics
GitHub - rafaelpadilla/Object-Detection-Metrics: Most popular metrics used to evaluate object detection algorithms.
Most popular metrics used to evaluate object detection algorithms. - GitHub - rafaelpadilla/Object-Detection-Metrics: Most popular metrics used to evaluate object detection algorithms.
github.com
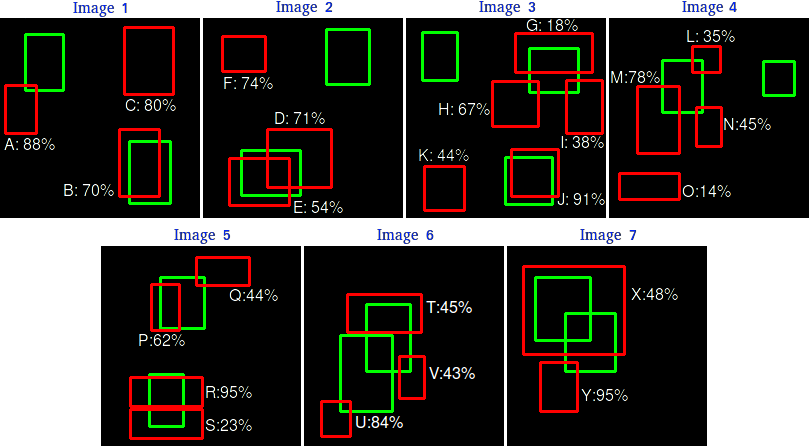
이미지가 7개 존재하고 ground truth는 15개이고 이는 Ground Truth Positive에 해당하는 숫자이다.(TP+FN)
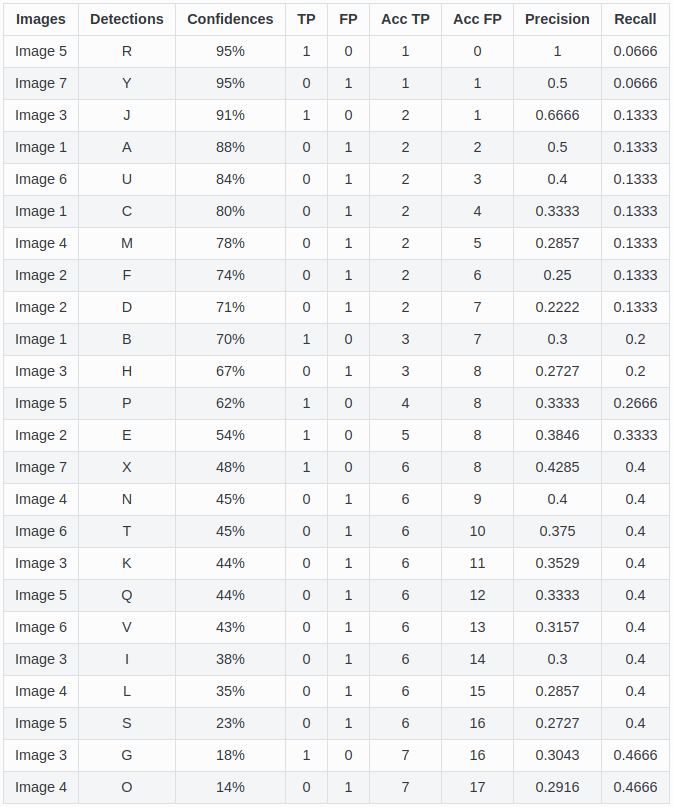
각 이미지에 대한 confidence score를 기반으로 내림차순으로 정렬하면 다음과 같으며 해당 Predicted Bounding box의 IoU를 기반으로 TP인지 FP인지를 판단하는 표를 나타나면 위 표와 같다. 이때 Precision과 Recall을 순차적으로 계산한다.
1행 (R) : Precision=1/1=1, Recall=1/15 = 0.0666
2행 (Y) : Precision=1/2=0.5, Recall=1/15 = 0.0666
3행 (J) : Precision=2/3=0.667, Recall=2/15 = 0.133
...
24행 (O) : Precision=7/24=0.2916, Recall=7/15=0.4667
이 Precision Recall을 이용하여 Curve를 만들면 다음과 같다.
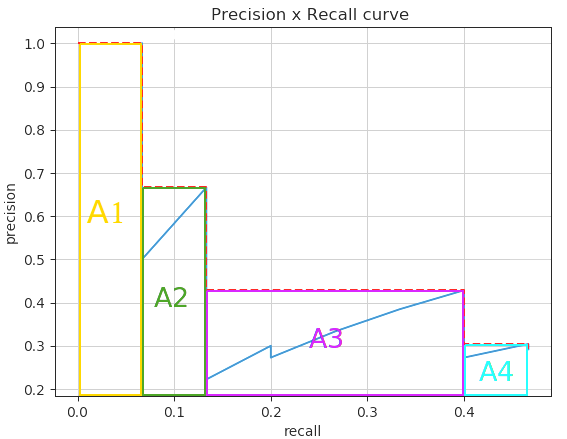
이를 보간법을 사용하여 Curve 면적을 구하면 다음과 같은 A 면적의 합이라 볼 수 있다.
mAP는 mean Average Precision으로 위에서 구한 Average Precision을 모든 class에 대한 AP를 구해 평균 낸 것을 의미한다.
mAP 코드 - 중략
GitHub - aladdinpersson/Machine-Learning-Collection: A resource for learning about ML, DL, PyTorch and TensorFlow. Feedback alwa
A resource for learning about ML, DL, PyTorch and TensorFlow. Feedback always appreciated :) - GitHub - aladdinpersson/Machine-Learning-Collection: A resource for learning about ML, DL, PyTorch and...
github.com
https://github.com/rafaelpadilla/Object-Detection-Metrics
GitHub - rafaelpadilla/Object-Detection-Metrics: Most popular metrics used to evaluate object detection algorithms.
Most popular metrics used to evaluate object detection algorithms. - GitHub - rafaelpadilla/Object-Detection-Metrics: Most popular metrics used to evaluate object detection algorithms.
github.com


